


If you’re a business owner with a website or looking into a website, you’ve probably heard of Google Analytics. A simple overview of Google Analytics (GA) would define it as a free program that tracks your website’s performance data. In reality, GA is a powerful tool that allows you to develop an insight into your business and online presence that can influence your decisions, track your income, and monitor your marketing efforts.
Google Analytics tracks how users find and use your website, tracking where they come from and what they do once they get there. You can track your ROI, identify where your main audience is, and even create a content or marketing strategy by analyzing your metrics.
Since Google Analytics is only one tool of the many that Google has created for websites and business owners, GA integrates easily with their other products like Google Search Console and your Google Ads Account.
Let’s dive in and look at what exactly Google Analytics is, why it’s important for your business, and how it works:
What is Google Analytics?
Launched in 2005, Google Analytics is a “web analytics service offered by Google that tracks and reports website traffic” [Source]. While that is quite a broad statement of what GA does, it’s not wrong.
Business owners rely on GA to track their website’s users and make educated decisions based on their user’s journey across their content. With the ability to dive into their location, interests, and even how they’re accessing your website – both by looking at their origination and by tracking the device they use.
Who is Google Analytics for?
Google Analytics was designed to help business owners track their website and online performance to make better decisions regarding their marketing. With the basic analytical tools provided by GA, businesses can start optimizing their website for SEO and establish a stronger online and offline marketing strategy.
Essentially, Google Analytics is for business owners with a website that are ready to expand the understanding of their business and develop strategies utilizing online analytics. Which should ultimately be all business owners that are marketing their business online with a website.
This includes service-based businesses, content marketers and creators, e-commerce-based businesses, and everything in between.
How Does Google Analytics Track Your Website Data?
Google Analytics tracks your website data by a small unique to your website code that you install in the header of your web pages. This small piece of Javascript, a coding language, runs in your viewer’s browsers when they visit your site and navigate the pages on your site.
Essentially, this code works with a larger file on Google’s server to collect information on the user’s activity. Every time a user visits your site, the code tracks their information. Additionally, the code sets a cookie on each visitor’s device.
Cookies are small pieces of data from your website that are stored within your user’s browser that your website will retrieve at a later time. Cookies are used to tell a server that users have returned to a particular website.
While Google Analytics does its best to be a reliable service, it’s not foolproof. There are times when it will pick up bots mass-visiting your website or block an IP address that shouldn’t be blocked – but, as the program learns and is developed over time, these events happen less frequently.
How Do You Install Your GA Tracking Code?
The exact process regarding how you need to install your Google Analytics tracking code or tracking ID is going to vary based on your website builder. Most websites allow you to easily add your tracking code to all your page’s headers with a simple backend addition.
WordPress and Showit are two of the easiest platforms to add your tracking code to thanks to their respective use of plugins and easy design backend. Platforms such as Squarespace, Wix, Google Sites, GoDaddy, etc. will have a built-in embed option for you to use.
If you’re working directly with a website designer they will typically include Google Analytics set-up in their design package or process.
What Does Google Analytics Do? What Does it Track?
Saying that Google Analytics tracks your website performance doesn’t tell you much right off the bat. You won’t learn the power of analytics without understanding exactly what those analytics are.
Google Analytics measures different performance metrics of your website such as the users on your website, pages visited, actions taken, time spent on the website and pages, traffic origination/acquisition, and more. With a plethora of metrics available, it’s hard to narrow down what to look at first. Luckily, Google makes their dashboard relatively easy to navigate – at least for the essentials.
* As of the beginning of 2023, there are two possibilities for your Google Analytics Dashboard – you may be utilizing the “Legacy Edition” or your website may be using GA4. When I mention what you can see on your dashboard, I’m referring to the GA4 edition as the Legacy edition will be phased out on July 1st, 2023.
What Are the Basic Analytics in GA?
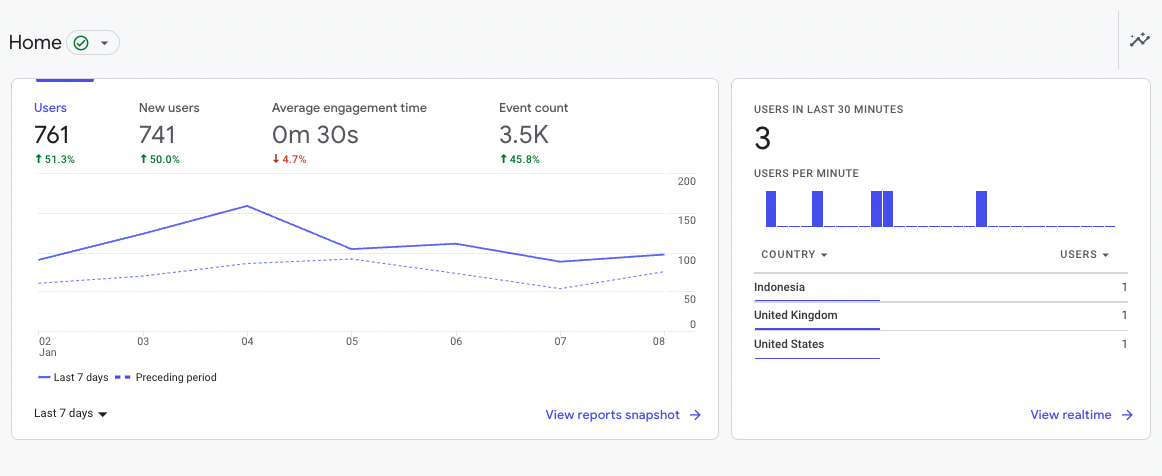
When you log into your Google Analytics account and view your dashboard, you’ll notice four main metrics: Users, New Users, Average Engagement Time, and Event Count. You’ll also notice a real-time view of users of your site in the last 30 minutes along with their country.
You can change these main analytics to match what you want to see when you’re more familiar with your metrics. Depending on how your dashboard is set up, your metrics may even look different right off the bat as GA4 has a “recommend” function that adds metrics that are suggested for you.
Users in GA4 refers to Active Users, the number of distinct users who visited your website or application. An active user is any user who has an engaged session.
New Users refers to the number of users who interacted with your site or launched your app for the first time. According to Google, this metric is measured by the number of new unique user IDs that logged the “first_open” or “first_visit” events.
Average Engagement Time is the average time a user spends engaging on your website.
Event Count is unique to GA4 and is every “hit” that involves a user on your website. This has no specific category or label and includes every action on your website, even including a simple page view.
What Can You Do With Google Analytics?
Have a better understanding of how your audience interacts with your website and business. You can do this by looking at the individual metrics provided by Google Analytics or by looking at your website’s performance over a set period of time – or a mixture of both.
GA4 has your metrics broken down into a lifecycle of performance metrics. You have Acquisition, Engagement, Monetization, and Retention. If you’re not looking for how your audience is behaving and you’re instead interested in who your audience is, GA4 has two options: Demographics and Tech.
Let’s break down the basics and what they do:
Acquisition
Acquisition is broken down into three main sections: Acquisition overview, User acquisition, and Traffic acquisition. The User acquisition report assists in understanding how new users for the first time, while the Traffic acquisition report allows you to understand what drives new and returning users to your website or app.
With both, you can learn where new users are coming from, which campaigns are driving the most users to your website, and identify if certain channels are more effective at driving traffic to your website.
Engagement
Engagement is separated into Engagement overview, Events, Conversions, Pages and screens, and Landing page.
Your Events report shows you information about what people are doing on your website. You’re able to discover how many people are performing specific actions, the revenue associated with each action, and the common actions your users are performing.
The Conversions report lets you know which conversion actions are most common. You can learn things such as why your users aren’t completing certain conversions, the number of users who performed specific conversion actions, the revenue associated with each conversion action, and how you can optimize your website to increase conversions.
Your Pages and screens report is what allows you to identify the web pages and app screens that your users are visiting and engaging with. You can learn which pages your users are spending the most time on and if you need to drive more traffic to certain pages that are ranking poorly.
Lastly, your Landing page report covers the effectiveness of the first pages your users land on when visiting your website. In your report, GA compares the differences in engagement time, conversions, new users, views, and total revenue based on the first page your users land on.
Monetization
Your Monetization reports are separated into four categories, Monetization overview, Ecommerce purchases, In-app purchases, and publisher ads.
Your Ecommerce purchases report covers your information about the products or services you sell on your ecommerce store. You can learn which product categories generate the most revenue, the products and services that have the fewest views, and even the products and services that people are adding to their shopping cart if the feature is in use.
Your In-app purchases report allows you to understand which in-app purchases are most common in your mobile app – if you have one.
Finally, your publisher ads report covers each ad that you place in your mobile app and the engagement and revenue associated with the ad.
What Are User Analytics in Google Analytics?
User analytics are the overview and breakdown of users visiting your website. This typically includes their demographics and the way they’re accessing your website and content. Depending on your website, you may also get additional insights such as interests or age.
User analytics has two categories, Demographics and Tech.
Demographics
Your Demographics details report classifies your website users by age, location, language, gender, and the interests they have based on their previous browsing history. You can use your demographics report to determine which users in specific locations are interested in your services, what your audience is interested in, and the language that most of your users read or speaks.
Tech
Your Tech details report is what allows you to understand the technology that people use to access your website – like their browser, screen resolution, app version, and operating system. You can use your tech details report to determine things like whether you need to improve your user experience based on popular devices if your users are using an Android or iOS device, and if your website is performing properly.
Why is it Important to Use Google Analytics for Your Business?
Google Analytics provides metrics that allow you to take an objective look at the performance of your business online – and how that traffic (or lack of traffic) is translating into conversions. You can also determine the failure/success of marketing campaigns, organic marketing, and which platforms are driving the most traffic.
When you can determine what is currently working in your business – and what’s not – you can change your tactic and invest your time and money in what will provide the best results.


[…] One of the most important aspects of SEO is tracking your website’s performance – and sadly, Showit doesn’t offer an in-house solution. Luckily, although Showit doesn’t have analytics, Showit does easily integrate with Google’s Performance and Analytics Dashboards. […]